About Projections
Introduction
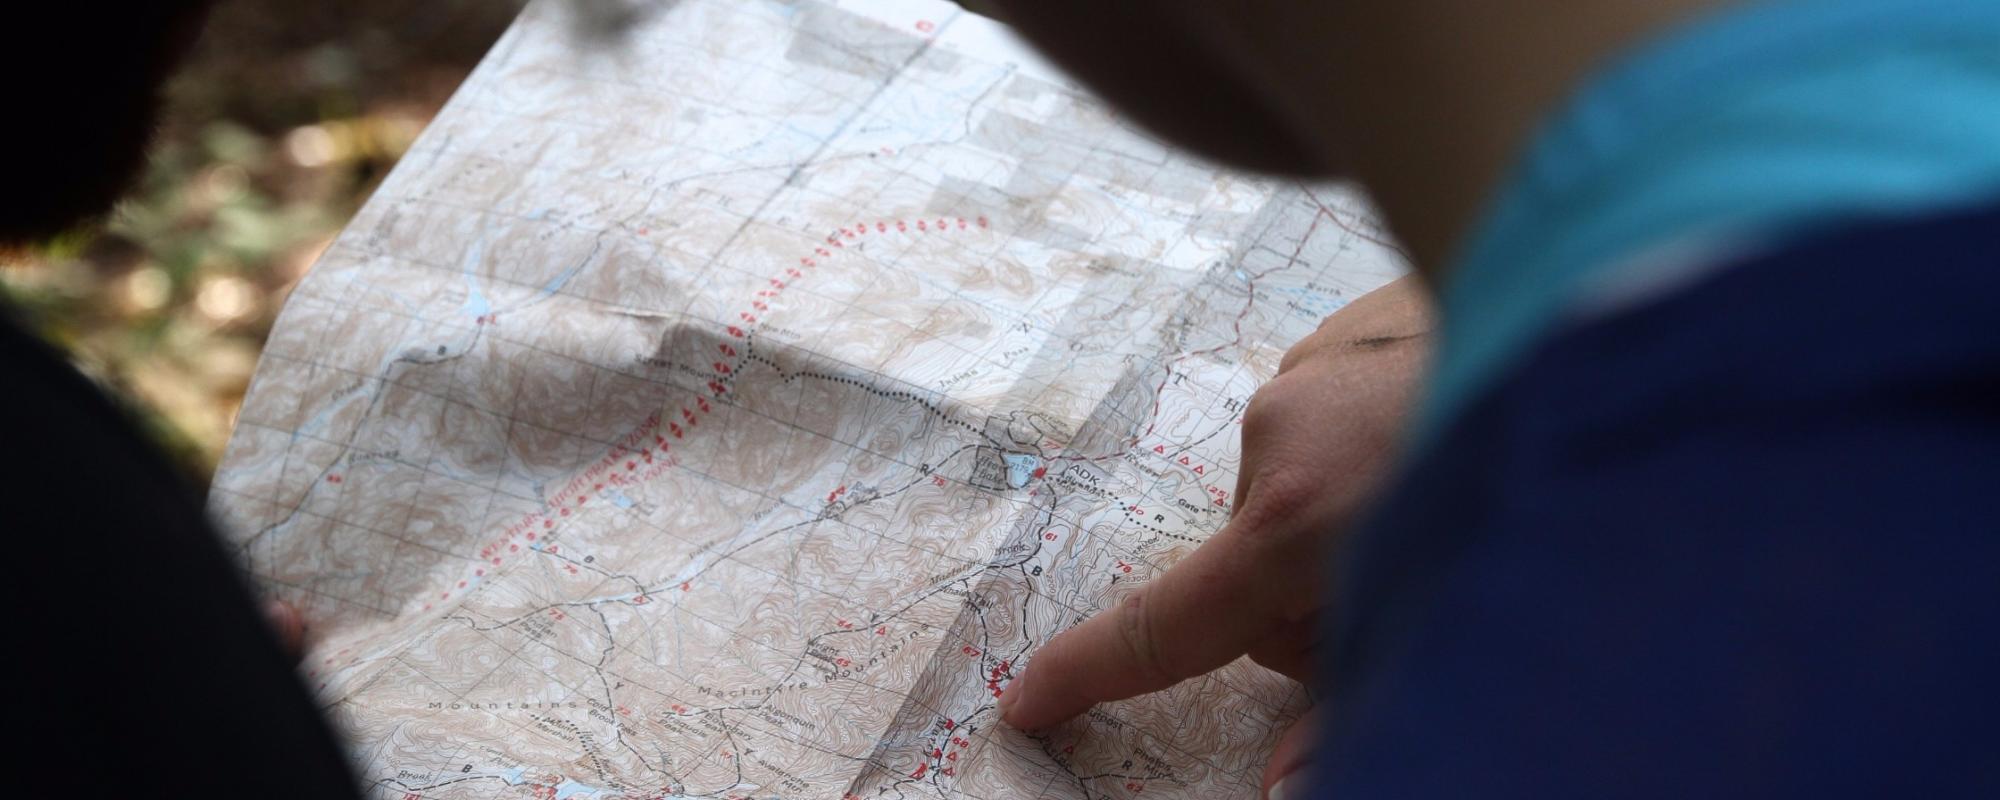
Having developed a coordinate system and measurement techniques for the Earth, the next problem map makers faced was how to transfer the information from the surface of a 3 dimensional (3D or spherical), irregularly shaped sphere (the Earth) to a 2-dimensional (2D or flat) ‘piece of paper’. This is not a simple as it sounds.
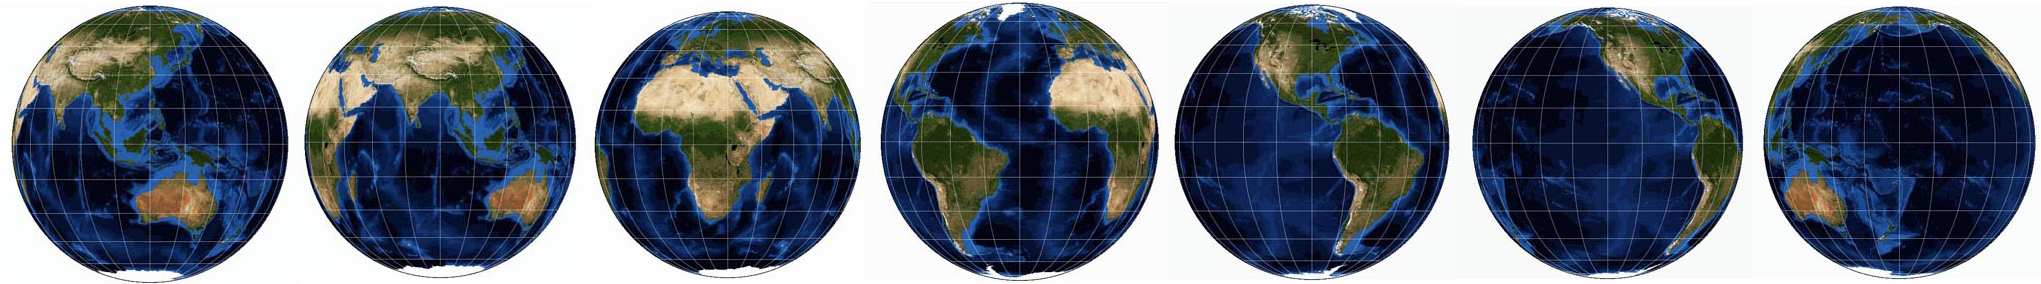
The images of the Earth as it might be seen from space, gives a good indication of the complexity of the problem facing map makers when it comes to converting the surface of a sphere on to a flat ‘piece of paper’. These seven images are viewed over the Equator. In each of these views the central area is clear, but at the edges shapes are distorted.
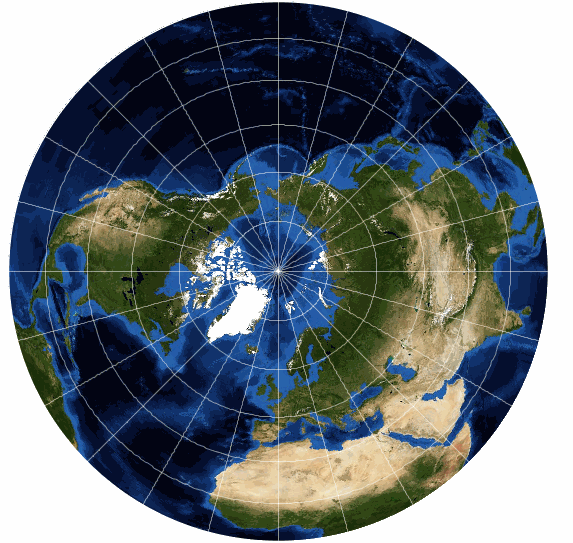
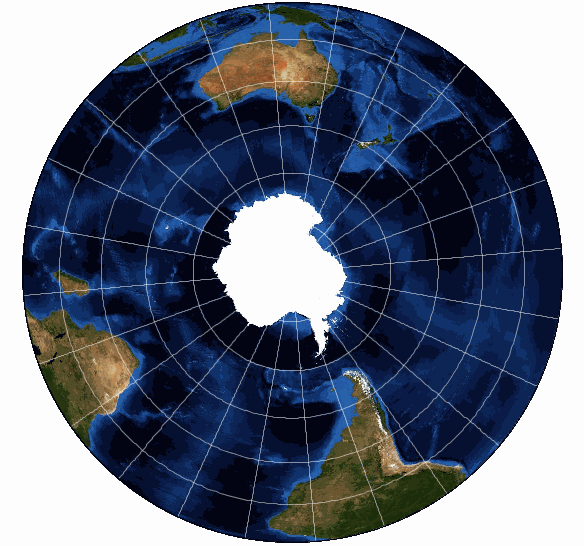
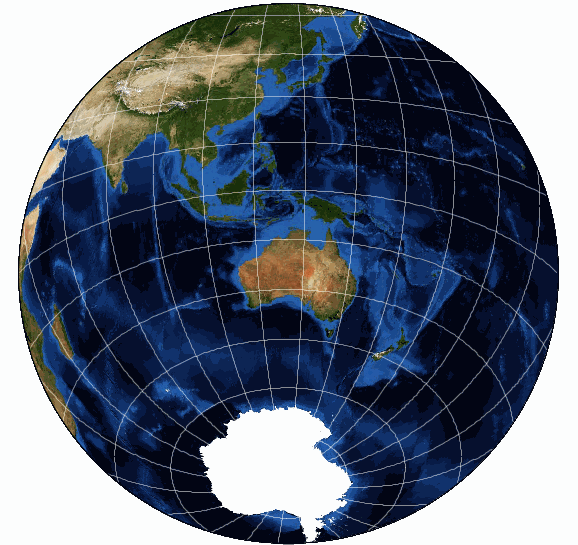
Beyond the Equator you need to twist your point of view to look directly at the area you are interested in. By way of example, note the way that Arctic, Antarctica and Australia appear on these views compared to when you look at them from the Equator (see above images).
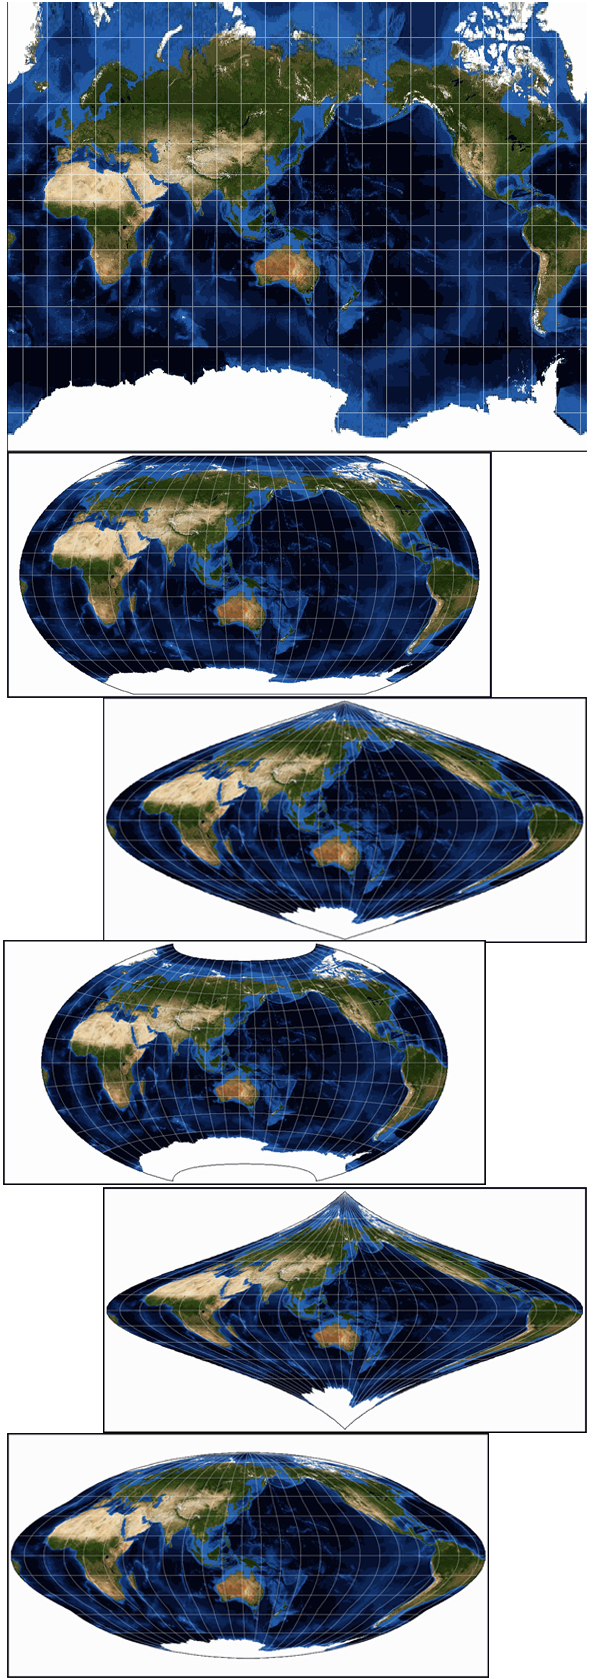
Over many centuries a vast number of techniques (often involving very complex mathematical formulae and models) have been developed to do just this. These are called projections. Projections are generally given a name so that they can be easily identified and referenced on a map. They are often named after the person(s) who invented them (eg Mercator); or aspects of the projection (eg Equidistant Conic); or a combination of the two (eg Lambert Conformal Conic).
Distortions
All projections result in some distortion of the relationships between features on the sphere when they are projected onto a flat surface. These distortions include:
» the direction between a feature and surrounding features
» the distance between a feature and surrounding features
» the shape of any feature
» the size of any feature
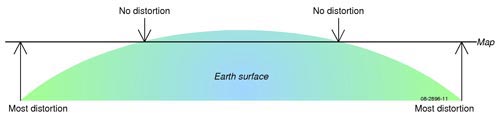
The only ‘projection’ which has all features with no distortion is a globe.
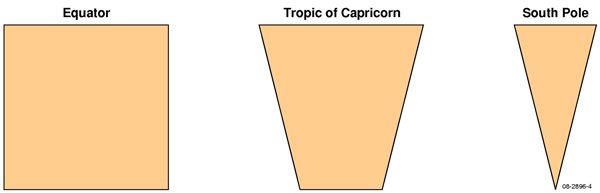
This problem is in part due to the changing relationship between latitude and longitude. Near the Equator a ‘block’ of
1° x 1° latitude and longitude is almost a square, while the same ‘block’ near the poles is almost a triangle.
There is no one perfect projection and a map maker must choose the one which best suits their needs.
Explaining Some Jargon – Projections and Maps
These are two terms which are commonly confused and the difference is simple:
A projection is a system of mathematics and geometry whereby the information on the surface of a sphere (the Earth) is able to be transferred onto a flat piece of paper (a map).
Describing Projections
There are two ways that projections are classified:
» Basic Type: depends on the characteristic that is preserved
» Basic Technique:depends on the method used to project features onto a flat surface
Projections are described by referring both of these.
Basic Projection Types
This describes how a map shows the positional relationship between two features, and their size and shape. Depending on their intended use, projections are chosen to preserve a particular relationship or characteristic. These include:
- Equal-Area — correctly shows the size of a feature
- Conformal — correctly shows the shape of features (A map can not be both equal-area or conformal – it can only be one; or the other; or neither.)
- Equidistant — correctly shows the distance between two features
- True Direction — correctly shows the direction between two features
Basic Projection Techniques
This describes the way an imaginary piece of paper (which will become the map) is laid on the Earth to obtain the latitude and longitude for the map.
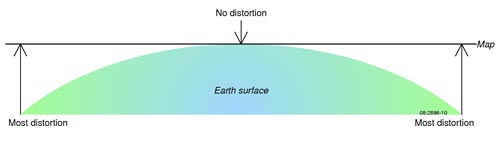
Where the imaginary ‘piece of paper’ touches the Earth there is no distortion on the map. As you move away from there however, distortions increase with distance. Because of this, map makers usually choose for the piece of paper to touch the Earth in the middle of a map – thereby minimising the amount of distortion.
Using this concept of an imaginary ‘piece of paper’ touching the Earth there are three basic techniques used to create a projection and therefore a map. These are:
- azimuthal — the imaginary ‘piece of paper’ is flat, this is usually used over Polar areas
- conical — the imaginary ‘piece of paper’ is rolled into a cone, this is usually used in mid-latitude areas (approximately 20° – 60° North and South)
- cylindrical — the imaginary ‘piece of paper’ is rolled into a cylinder, this is usually used over Equatorial areas or for World Maps
These basic techniques have different distortions and therefore limitations to their use – see below for descriptions of these. Each technique type has a region of the Earth where it is usually used. However, any of the three projection techniques can be used for any area of the Earth.
Explaining Some Jargon – Standard Parallel and Central Meridian
Map makers have technical terms to describe the line of latitude or longitude where this imaginary ‘piece of paper’ touches the Earth. These are:
» for a line of latitude – standard parallel
» for a line of longitude – central meridian
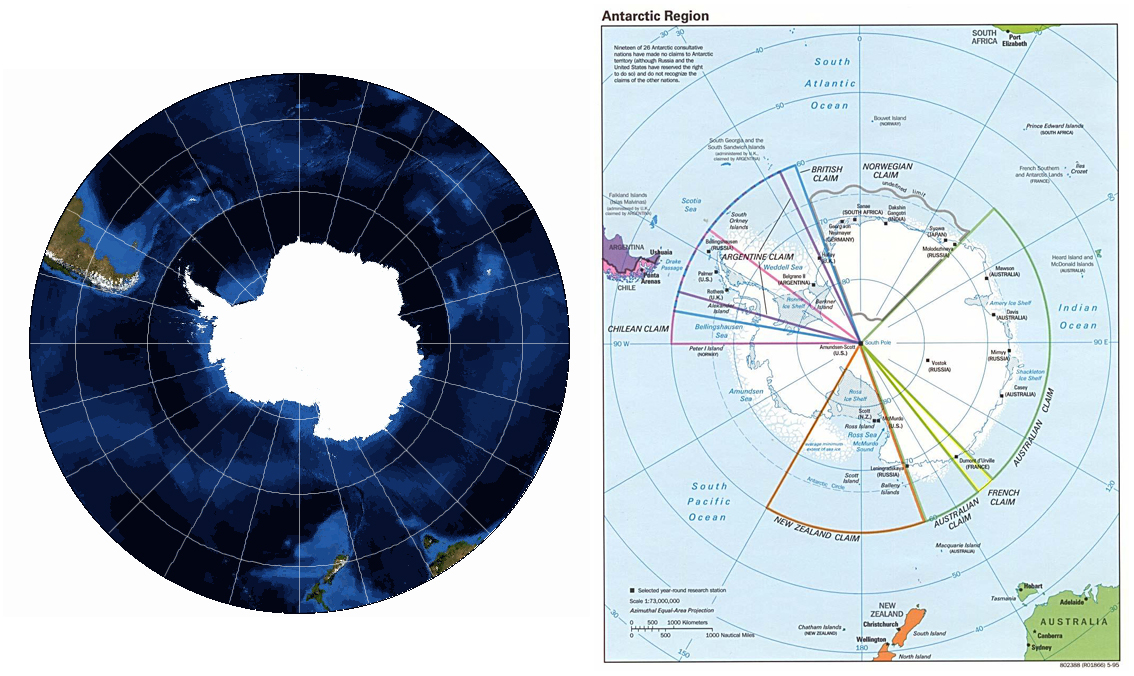
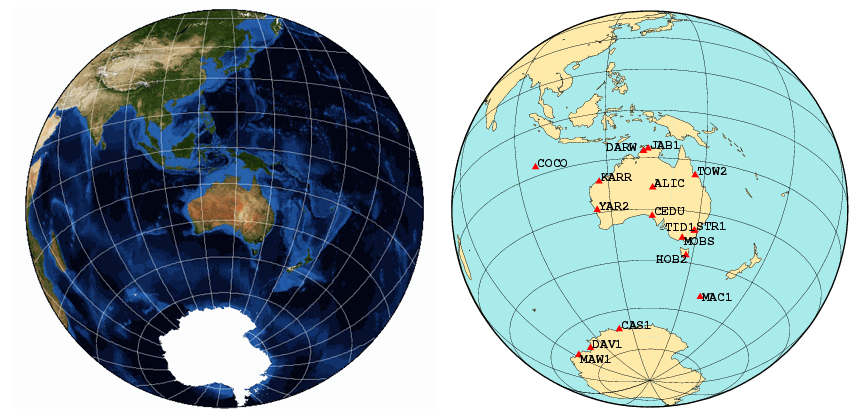
Azimuthal Projections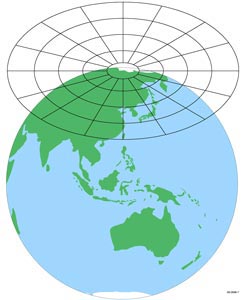
This projection is based on a ‘flat piece of paper’ touching the Earth at a point. The point is usually a Pole, but this is not essential.
Azimuth is a mathematical concept with relates to the relationship between a point and the ‘flat piece of paper’ that ’touches‘ the Earth. It is usually measured as an angle. The word itself is believed to have come from an Arabic word mean the way – referring to the way or direction a person faces.
These projections:
- have distortions increasing away from the central point
- have very small distortions near the centre point (the ’touch point of the paper‘)
- compass direction is only correct from the centre point to another feature – not between other features
- are not usually used near the Equator, because other projections better represent the features in this area.
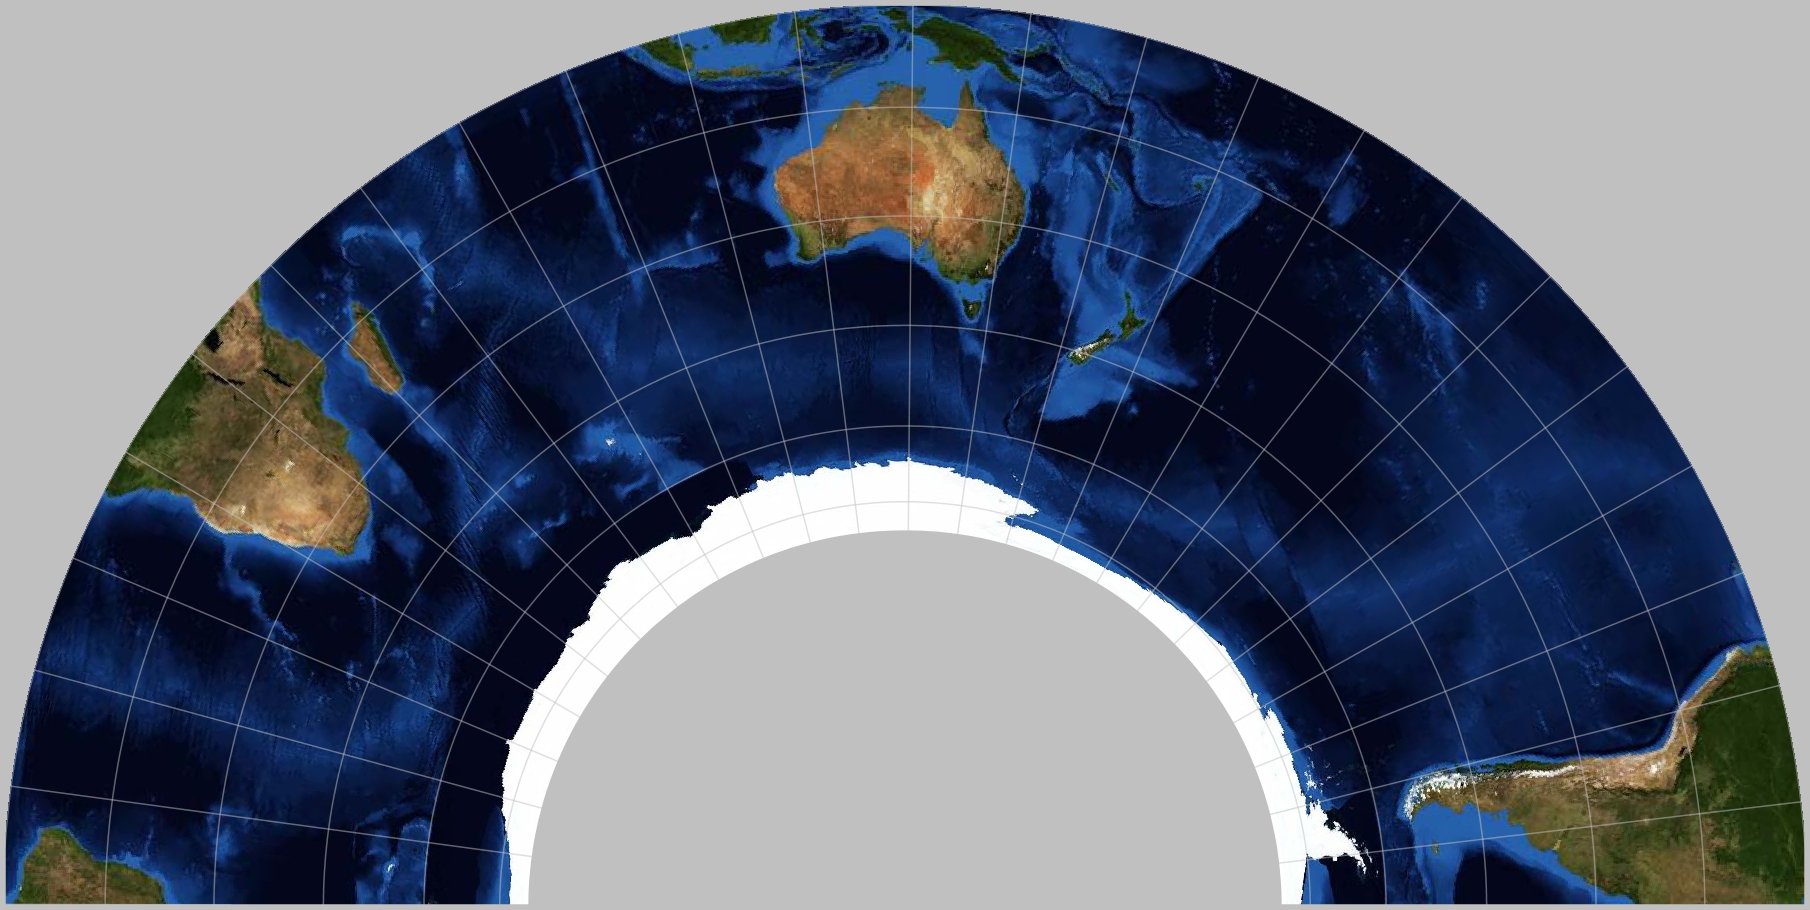
Conical Projections
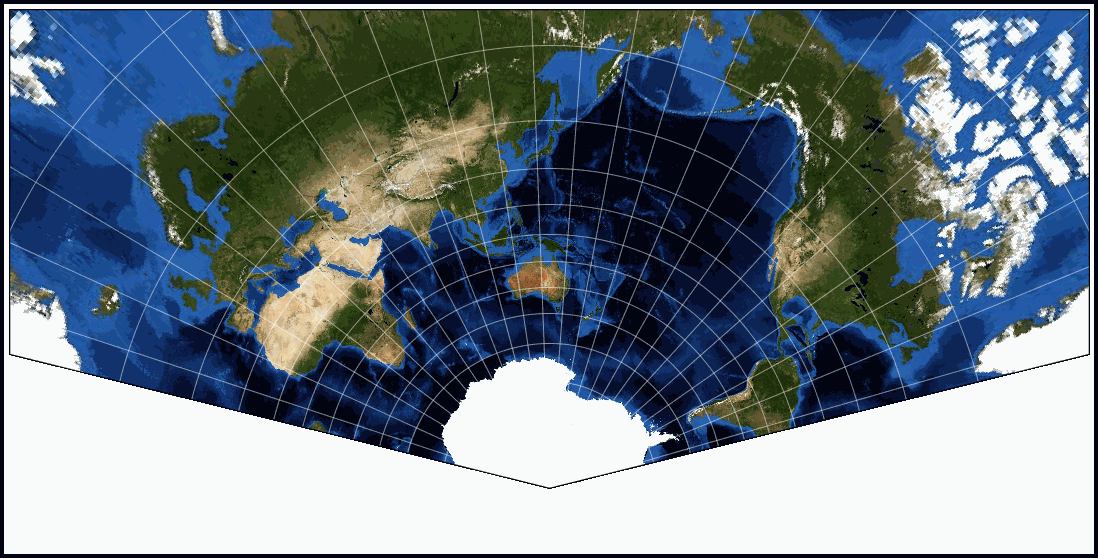
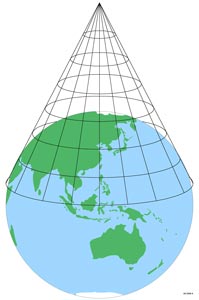 This projection is based on the concept of the ‘piece of paper’ being rolled into a cone shape and touching the Earth on a circular line. Most commonly, the tip of the cone is positioned over a Pole and the line where the cone touches the earth is a line of latitude; but this is not essential. The line of latitude where the cone touches the Earth is called a Standard Parallel.
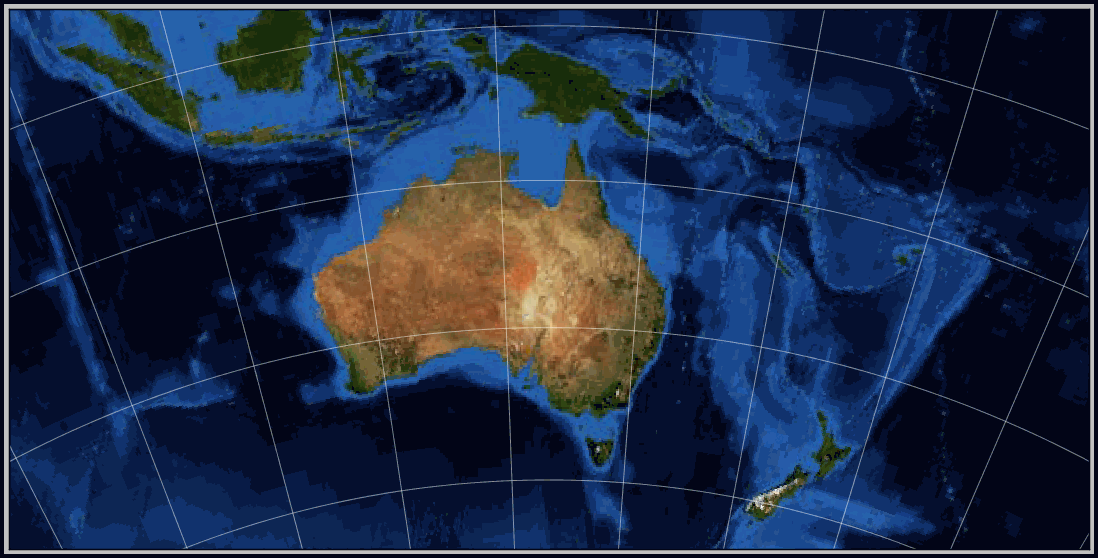
Conic projections are usually used for regional ⁄ national maps of mid-latitude areas – such as Australia and the United States of America.
These projections:
- are fan shaped when used to map large areas
- have distortions increasing away from the central circular line (the ‘touch point of the paper’)
- have very small distortions along the central circular line (the ‘touch point of the paper’)
- shapes are shown correctly, but size is distorted
- usually have lines of longitude fanning out from each other and have lines of latitude as open concentric circles.
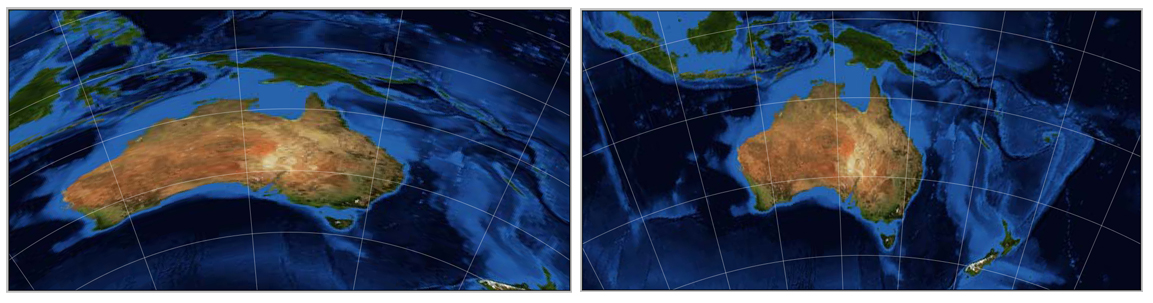
Cylindrical Projections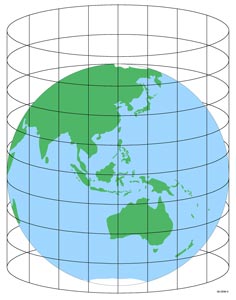
This projection is based on the concept of the ‘piece of paper’ being rolled into a cylinder and touching the Earth on a circular line. The cylinder is usually positioned over the Equator, but this is not essential.
Cylindrical projections are usually used for world maps or regional ⁄ national maps of Equatorial areas – such as Papua New Guinea.
These projections usually:
- are rectangular or oval shaped – but this projection technique is very variable in its shape
- have lines of longitude and latitude at right-angles to each other
- have distortions increasing away from the central circular line (the ‘touch point of the paper’)
- have very small distortions along the central circular line (the ‘touch point of the paper’)
- show shapes correctly, but size is distorted.
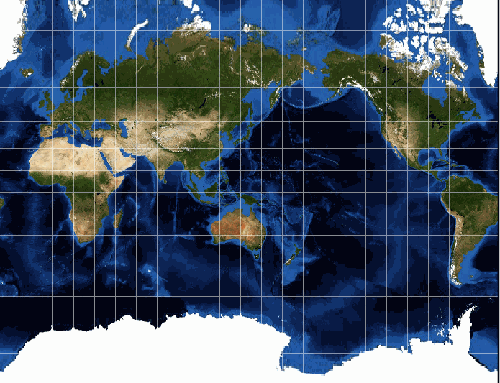
Notice the huge distortions in the Arctic and Antarctic regions, but the reasonable representation of landmasses out to about 50° north and south.
Explaining Some Jargon – Cylindrical and Pseudo–Cylindrical Projections
The first Cylindrical Projections developed had the lines of latitude and lines of longitude shown as straight lines – see the section on the Mercator projection.
With advances in computers it became possible to calculate the lines of longitude as curves – thereby reducing distortions near the Poles – see the section on the Robinson projection.
To distinguish between these two projections the first continued to be called a Cylindrical Projection, but the second (with the curving lines of longitude) was called Pseudo–Cylindrical Projection.
Its all in the name
A projection’s name is often a good indicator of some of its properties.
Firstly
Projections are often named after their creator – famous names include Albers, Lambert, Mercator and Robinson. However, without inside knowledge, this gives no indication of the properties of a projection.
Secondly
The projection name may refer to some of its attributes – quite commonly Equal-Area, Conformal and Equidistant are included in a projection’s name.
Thirdly
The projection name may refer to its source technique – conic and azimuthal are the one which is most commonly used here. (There is an element of assumption that a projection is cylindrical if not otherwise stated.)
Variations to these Basic Techniques
The techniques described above are in their simplest form. From here it gets more complicated. The array of mathematical and geometric variations to these basic techniques described above is only limited by the imagination of the projection’s creator and their capacity to calculate complex formulae (in the modern era this is made simpler by the use of advanced computers).
Some (but far from all) of variations to the three basic techniques are:
- bipolar – azimuthal, but two separate ‘pieces of paper’ are used one over each Pole
- polyconic – two or more ‘cones’ are placed over the Earth – these may be ‘nested’ inside each other or placed elsewhere – eg centred over the Americas, Europe ⁄ Africa, Asia and the Pacific.
- Sinusoidal – describes the mathematics of how the lines of longitude (meridians) are calculated in some Pseudo-Cylindrical Projections.
Multiple Standard Parallels or Central Meridians
One very common variation is to have more than one ‘touch point of the paper’ to the Earth – i.e. two or more Standard Parallels (or Central Meridians). As we have learnt above, the areas near the Standard Parallel have less distortion than those further away from the ‘touch point of the paper’. By having two Standard Parallels the distortion levels across the map are kept to a minimum and increase the overall accuracy of the map.
Using this conic projection as an example, the 'piece of paper' appears to 'slice through' the Earth – thereby touching the surface of the Earth in two places and creating two Standard Parallels.
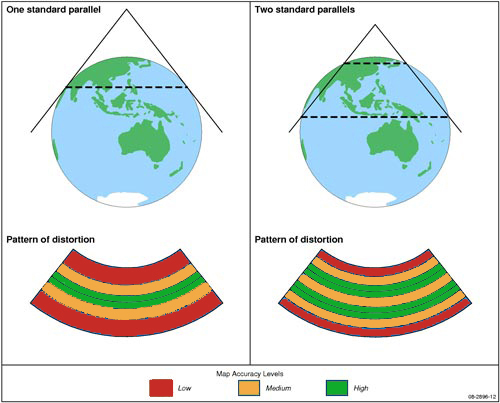
When placing the Standard Parallels, it is best to have them about 1 ⁄ 4 to 1 ⁄ 3 of the way in from the edge of the map – this minimises the distortion across the map. For example, in the case of a map of Australia which extends from about 10° to 45° South the Standard Parallels most commonly used are 18° and 36° South.
Merits and Limitations of Projections
As stated above, no projection is able to accurately show the correct compass direction, distance, shape and area of all features depicted on it. Because of this, each projection has advantages and disadvantages, as well as serving different purposes and producing different types of distortions.
As a general rule, maps of local areas have less distortions than those of larger areas or the world.
Many special projections have been developed to specifically overcome some of these distortions. For example:
- 'equal-area' projections preserve true areas
- 'conformal' projections preserve true shape
- 'azimuthal' projections preserve true compass direction from the centre.
As a general rule the best projection to use is dictated by the map's:
- location (equatorial, polar, or mid latitudes)
- extent ⁄ size (world vs regional vs local)
- purpose (distortion may not be an issue, but keeping equal-areas or true direction may be important).
When selecting a projection, map makers should also consider national conventions and consistency with other maps of an area.
The USA Geological Survey (USGS) has produced a particularly useful poster which summarises the merits and shortcomings of a selection of commonly used projections: http://egsc.usgs.gov/isb//pubs/MapProjections/projections.html. A PDF version of the web page is also available.
Further Reading
- Paul B. Anderson FCCS (USN, Retired) Old Dominion University Geography Department, GIS Teaching Assistant Kingsport – Map Projections
- http://www.csiss.org/map-projections/index.html/
http://www.galleryofmapprojections.com/images/Aust_Centered_2009.jpg
http://www.galleryofmapprojections.com/gedymin/gedymin_prof_11x17.pdf
- B.J.S. Cahill – Butterfly Map Resource Page, Octahedral Map of the World
- http://www.genekeyes.com/B.J.S._CAHILL_RESOURCE.html
- B.J.S. Cahill – Geocells and the Megamap
- http://www.genekeyes.com/Geocells.html
- Carlos A Furuti – Map Projections
- http://www.progonos.com/furuti/MapProj/
- City University of New York, Hunter College – Map Projection Home Page
- http://www.geo.hunter.cuny.edu/mp/index.html
- ESRI – Understanding Map Projections
- WlframMapWorld – Map Projections
- http://mathworld.wolfram.com/MapProjection.html